The state of enterprise AI, late 2026: what the reports agree on, and where they contradict each other
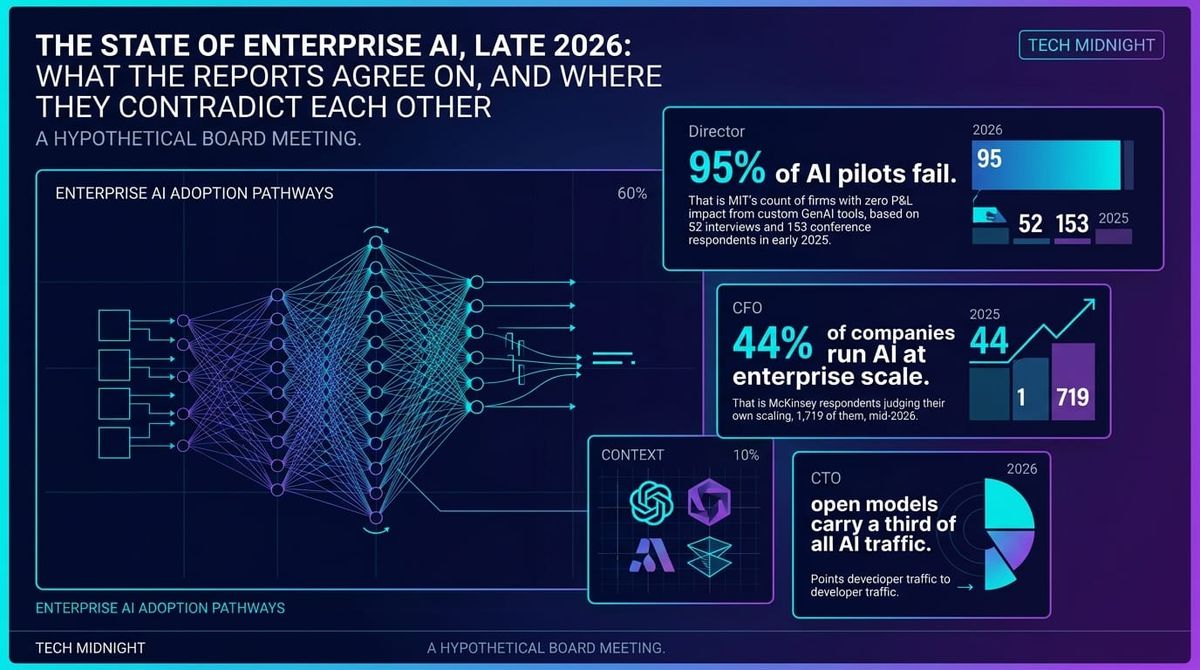
A hypothetical board meeting. Four people quote four reports, all of them correctly:
- A director: 95% of AI pilots fail. That is MIT's count of firms with zero P&L impact from custom GenAI tools, based on 52 interviews and 153 conference respondents in early 2025.
- The CFO: 44% of companies run AI at enterprise scale. That is McKinsey respondents judging their own scaling, 1,719 of them, mid-2026.
- The CTO: open models carry a third of all AI traffic. That is developer traffic through one model router, OpenRouter.
- Procurement: open models are 11% of enterprise use, and shrinking. That is API usage at 495 US enterprises, surveyed by Menlo Ventures.
Each report measures something different. Ask who was asked and what was counted, and most contradictions dissolve. What remains is where the real uncertainty sits.
The position: no single report tells you where enterprise AI stands. Read them side by side and treat the disagreements as the finding. Apply the same test to your own AI metrics.
The short version:
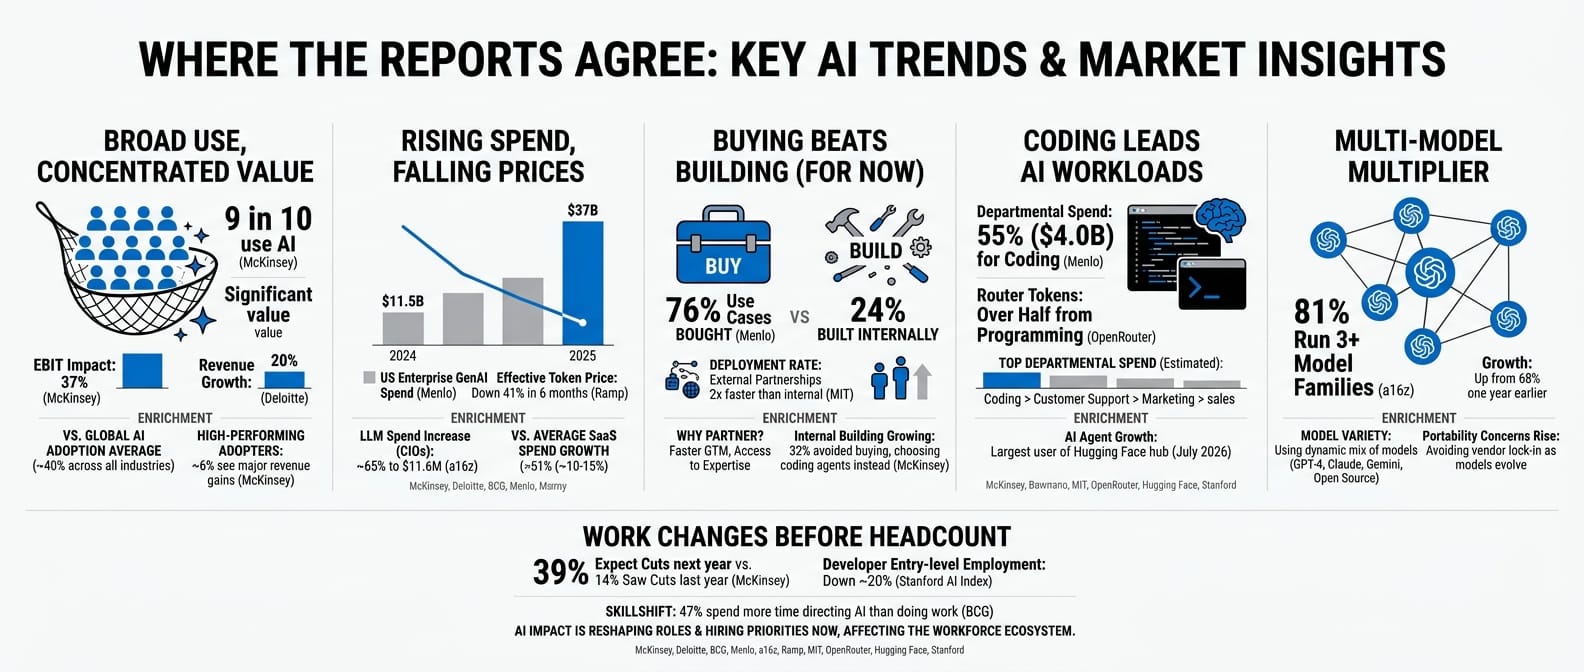
- Use is near universal, value is not: around 9 in 10 organisations use AI somewhere; 37% report any EBIT impact (McKinsey), and 20% see revenue growth from it (Deloitte).
- Spend rises, unit cost falls: US enterprise GenAI spend tripled to $37B in 2025 (Menlo), while token prices fell 41% in six months (Ramp).
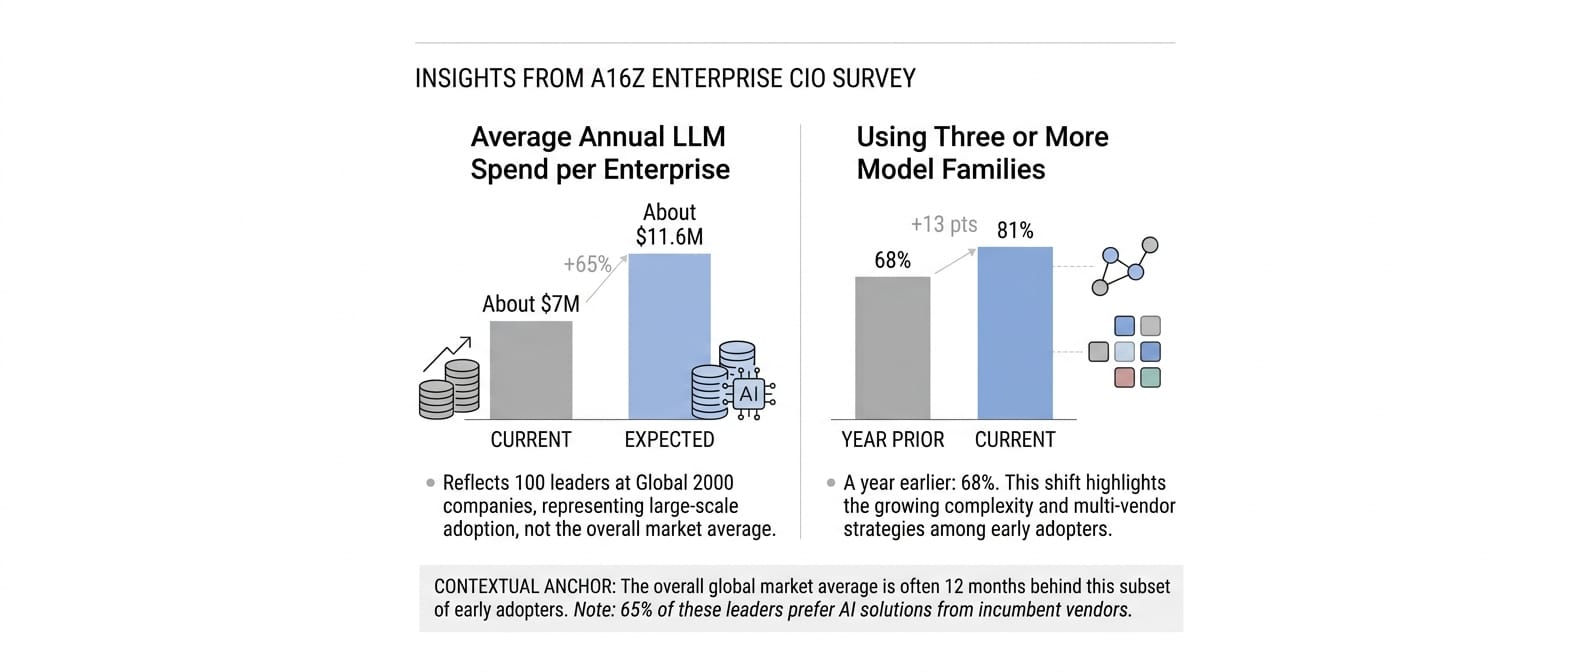
- Multi-model is already the norm: 81% of large enterprises run three or more model families (a16z).
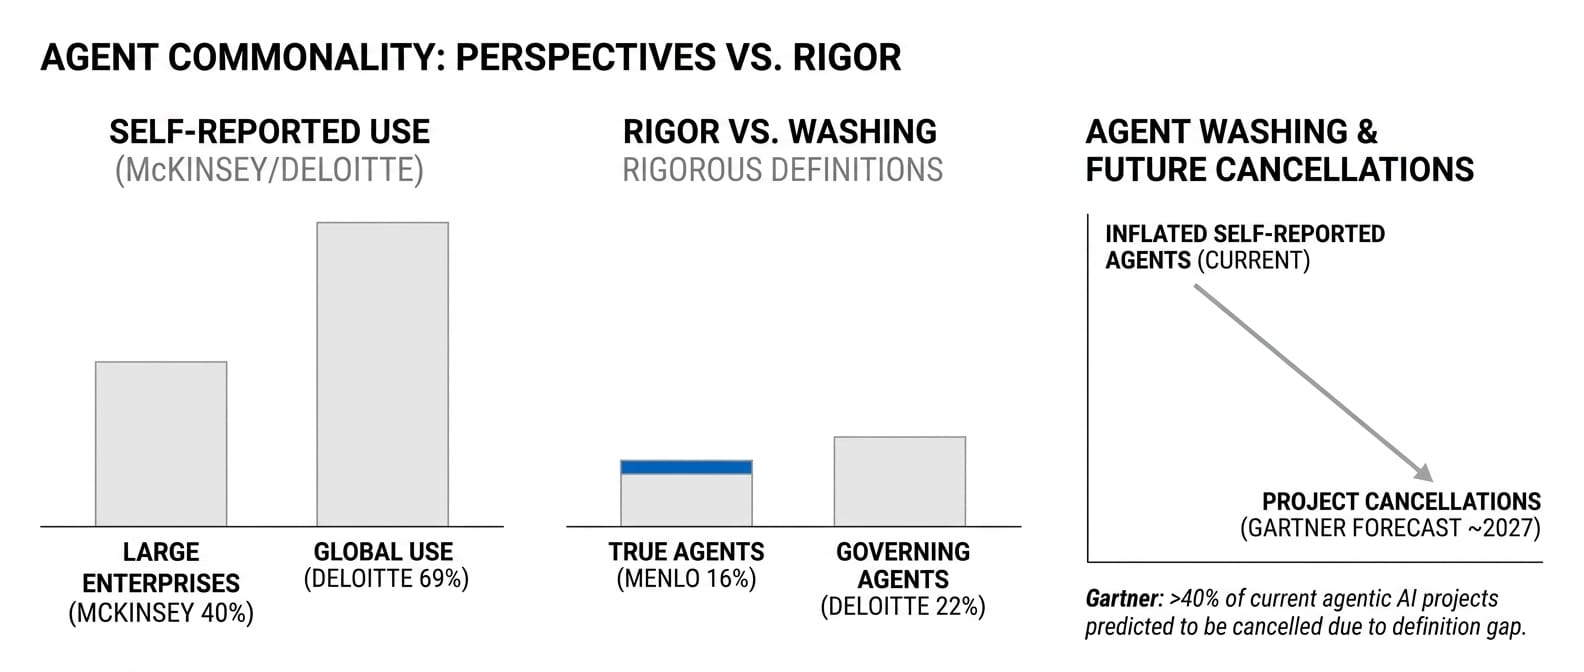
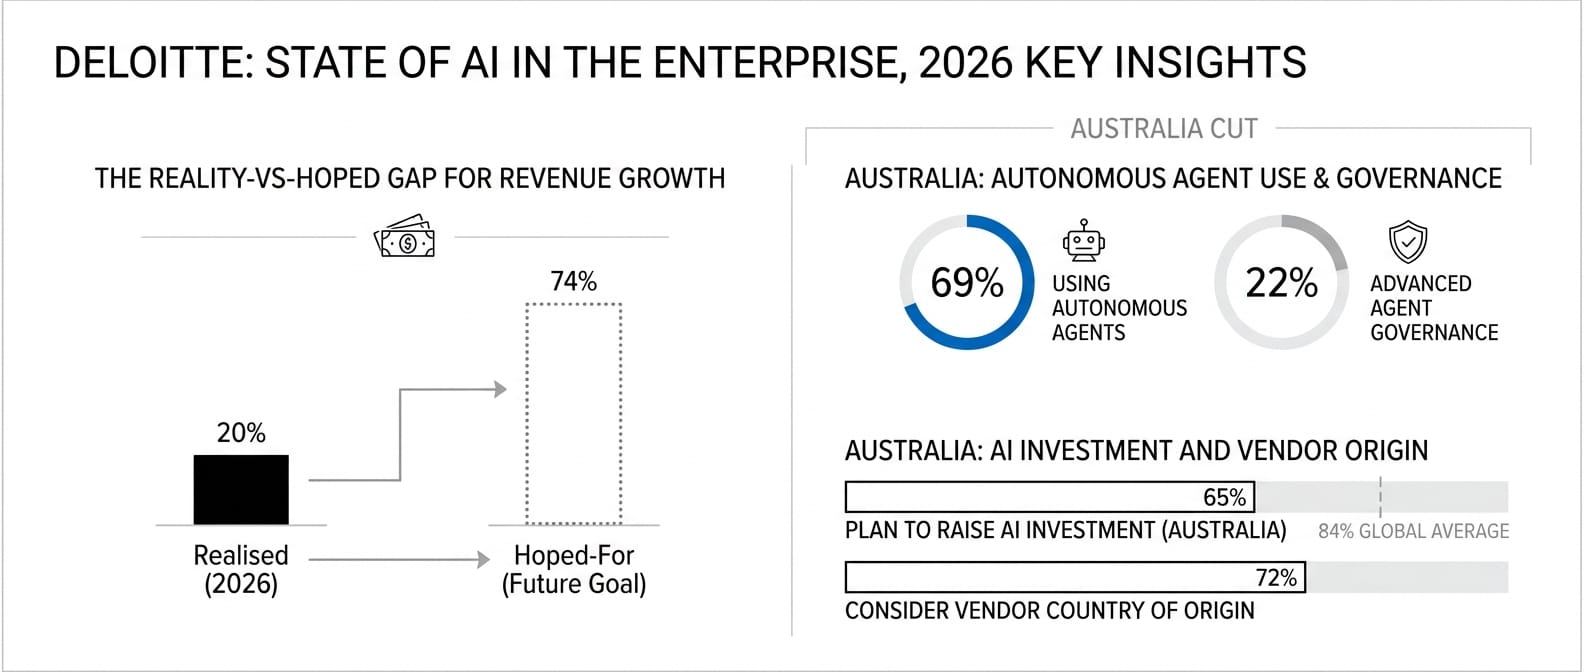
- "Agent" has no shared definition: 16% of enterprise deployments are true agents (Menlo), 40% of large companies are scaling agents (McKinsey), 69% of Australian leaders say they use autonomous agents (Deloitte).
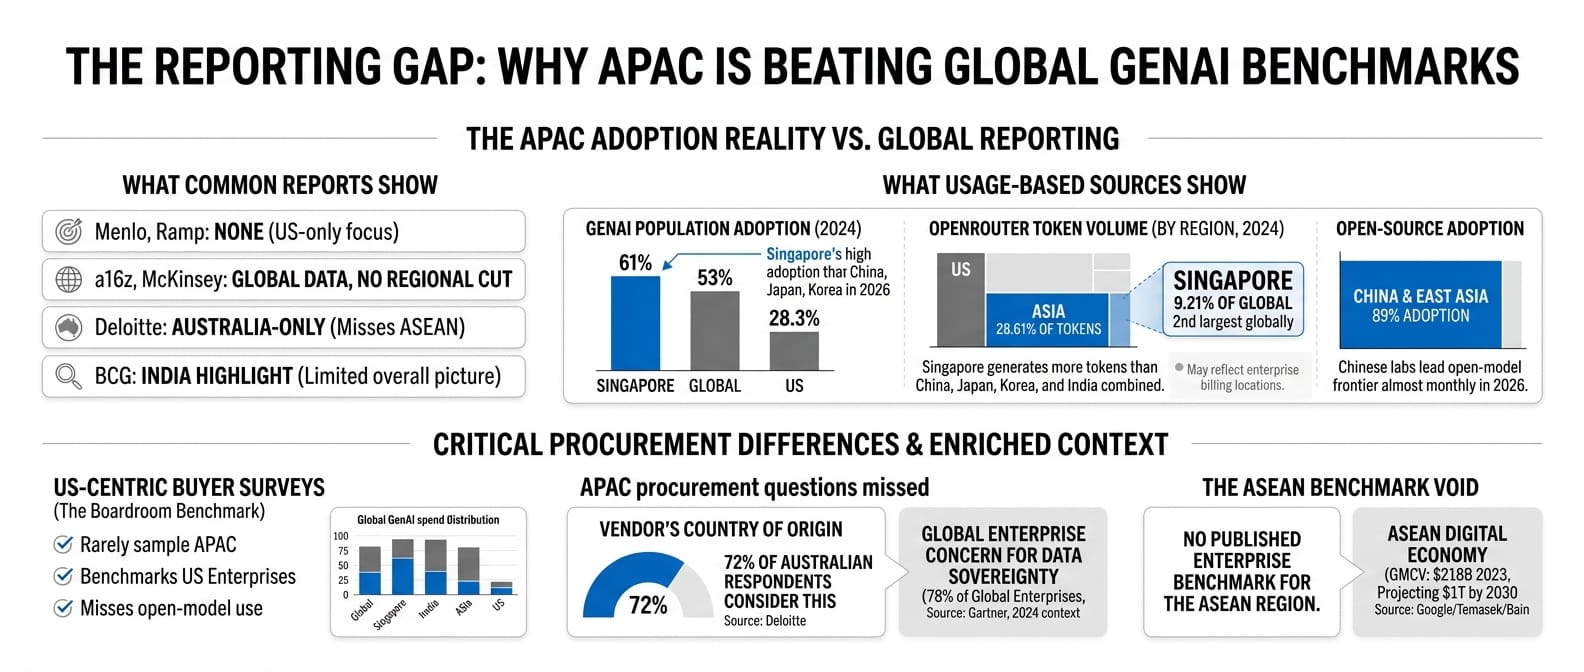
- APAC is under-measured: two of the major reports are US-only and none has an ASEAN enterprise cut, yet Singapore shows 61% population adoption and 9.21% of global OpenRouter tokens.
In this article:
Part 1: What the reports say
- What the reports measure: buyers, workers, telemetry and indices, and who paid
- One word, several meanings: adoption, production, value and agent
- Where the reports agree: six findings that hold across methods
- Where they contradict each other: six disagreements and what causes them
- What the reports miss: APAC: the region the benchmarks under-sample
- How to read the next AI report: seven questions before you quote a number
- Where this is going: how the evidence base changes next
Part 2: The reports, one by one
- Twelve reports, one card each: sample, method, headline numbers, what to watch for
Part 1: What the reports say
What the reports measure
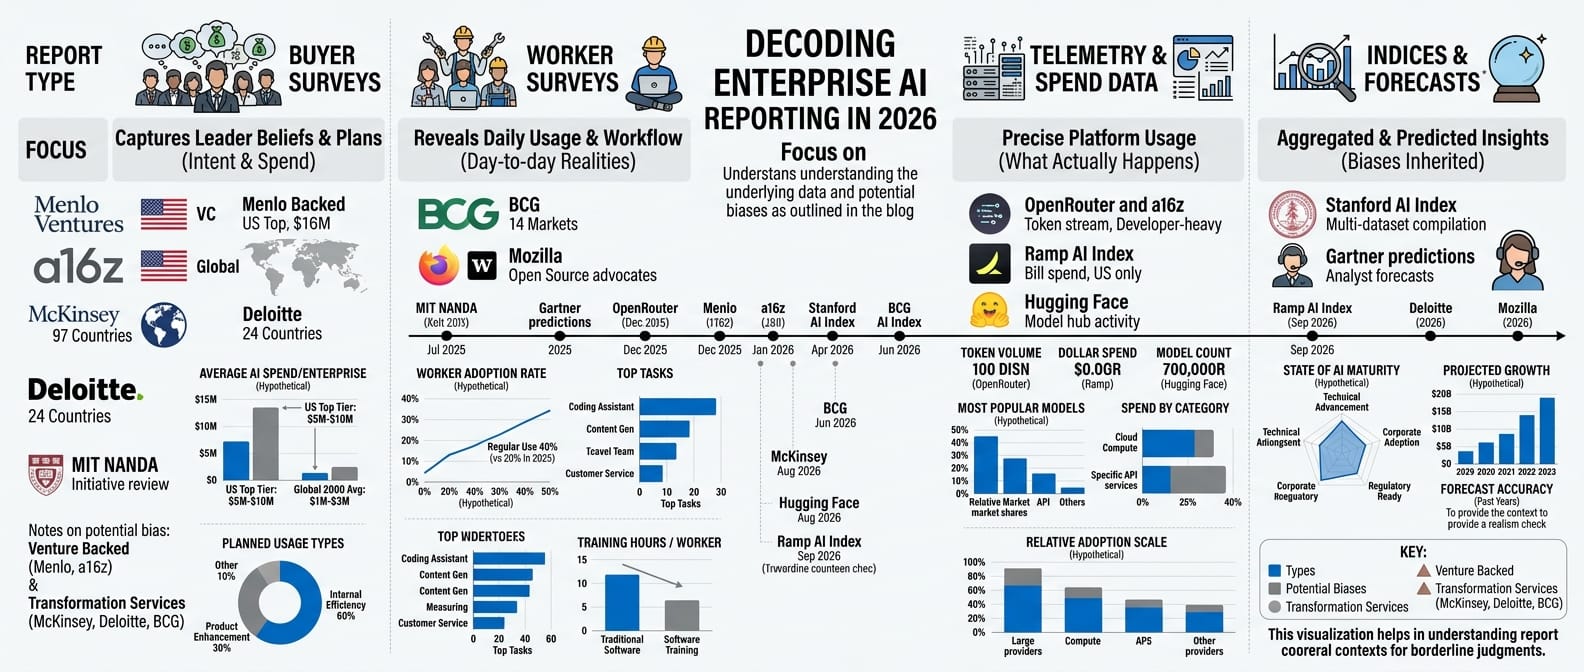
Twelve sources cover most of the enterprise AI conversation in 2026. They fall into four kinds, and the kind decides what a number can mean.
| Report | What it measures | Size | Region |
|---|---|---|---|
| Menlo Ventures, State of GenAI in the Enterprise (Dec 2025) | Survey of enterprise AI decision-makers | 495 | US only |
| a16z enterprise CIO survey (Jan 2026) | Survey of Global 2000 IT leaders, not random | 100 | Global, no regional cut |
| McKinsey, State of AI 2026 (Aug 2026) | Survey of managers and executives | 1,719 | 97 countries |
| Deloitte, State of AI in the Enterprise (2026) | Survey of senior leaders | 3,235 | 24 countries |
| MIT NANDA, The GenAI Divide (Jul 2025) | Initiative review, interviews, conference survey | 300+ / 52 / 153 | Not disclosed |
| BCG, AI at Work (Jun 2026) | Survey of workers | 11,749 | 14 markets |
| Mozilla, State of Open Source AI (2026) | Survey of developers plus analysis | 950+ | Global |
| OpenRouter and a16z, State of AI (Dec 2025) | Token telemetry from a model router | 100T+ tokens | Global, developer-heavy |
| Ramp AI Index (Sep 2026) | Business card and bill spend | Not disclosed | US only |
| Hugging Face, State of Open Models (Aug 2026) | Model hub activity | 2.96M model repos | Global |
| Stanford AI Index 2026 (Apr 2026) | Compiled index of many datasets | n/a | Global |
| Gartner predictions (2025) | Analyst forecasts plus a webinar poll | 3,412 poll | Global |
The four kinds:
- Buyer surveys (Menlo, a16z, McKinsey, Deloitte, MIT) tell you what leaders believe and plan. They are good on intent and spend, weak on what actually runs.
- Worker surveys (BCG, Mozilla) tell you what people do day to day. They are good on usage, weak on business value.
- Telemetry and spend data (OpenRouter, Ramp, Hugging Face) count what actually happens. They are precise about their own platform and blind to everything outside it.
- Indices and forecasts (Stanford, Gartner) aggregate or predict. They inherit the strengths and the biases of their inputs.
Then check who paid. Menlo and a16z are venture investors with portfolio exposure to the vendors they rank, and both disclose it.
McKinsey, Deloitte and BCG sell transformation services, so "value is hard to capture without redesign" is both a finding and a sales argument. Mozilla advocates for open-source AI.
None of this makes the numbers wrong. It tells you which way a borderline judgement is likely to lean.
One word, several meanings
Most apparent contradictions come from four words that every report uses and no two define the same way.
| Word | Narrow reading | Broad reading | Example |
|---|---|---|---|
| Adoption | Paid enterprise contract in production | Anyone in the organisation uses any AI tool | 56.1% of US businesses pay for AI (Ramp) vs 9 in 10 organisations use it somewhere (McKinsey) |
| Production | Integrated into a workflow with measured outcome | Deployed to users | 5% of task-specific GenAI reaches production (MIT) vs 47% of AI purchases convert to production (Menlo) |
| Value | Measurable P&L impact | Respondent feels more productive | 37% report EBIT impact vs 80% report individual productivity gains (both McKinsey) |
| Agent | System that plans, acts and observes on its own | Any assistant with tool calls, or any reasoning model | 16% true agents (Menlo) vs 69% "use autonomous agents" (Deloitte, Australia) |
The McKinsey row is the clearest case. The same survey, the same respondents, finds 80% individual productivity gains and 37% enterprise EBIT impact. Both are true.
They measure different things.
When you read "AI adoption", ask which row it sits in before you compare it to anything.
Where the reports agree
Some findings hold across buyer surveys, worker surveys and telemetry alike.
| Finding | Evidence | Sources |
|---|---|---|
| Use is broad, value is concentrated | 9 in 10 use AI; 37% see EBIT impact; 20% see revenue growth | McKinsey, Deloitte, BCG |
| Spend rises, unit prices fall | $37B US enterprise spend (from $11.5B); token prices down 41% in six months | Menlo, a16z, Ramp |
| Buying beats building, for now | 76% of use cases bought; partnerships deploy twice as often | Menlo, MIT, McKinsey |
| Coding scales first | 55% of departmental AI spend; over half of router tokens | Menlo, OpenRouter, Hugging Face |
| Multi-model is the norm | 81% run three or more model families | a16z |
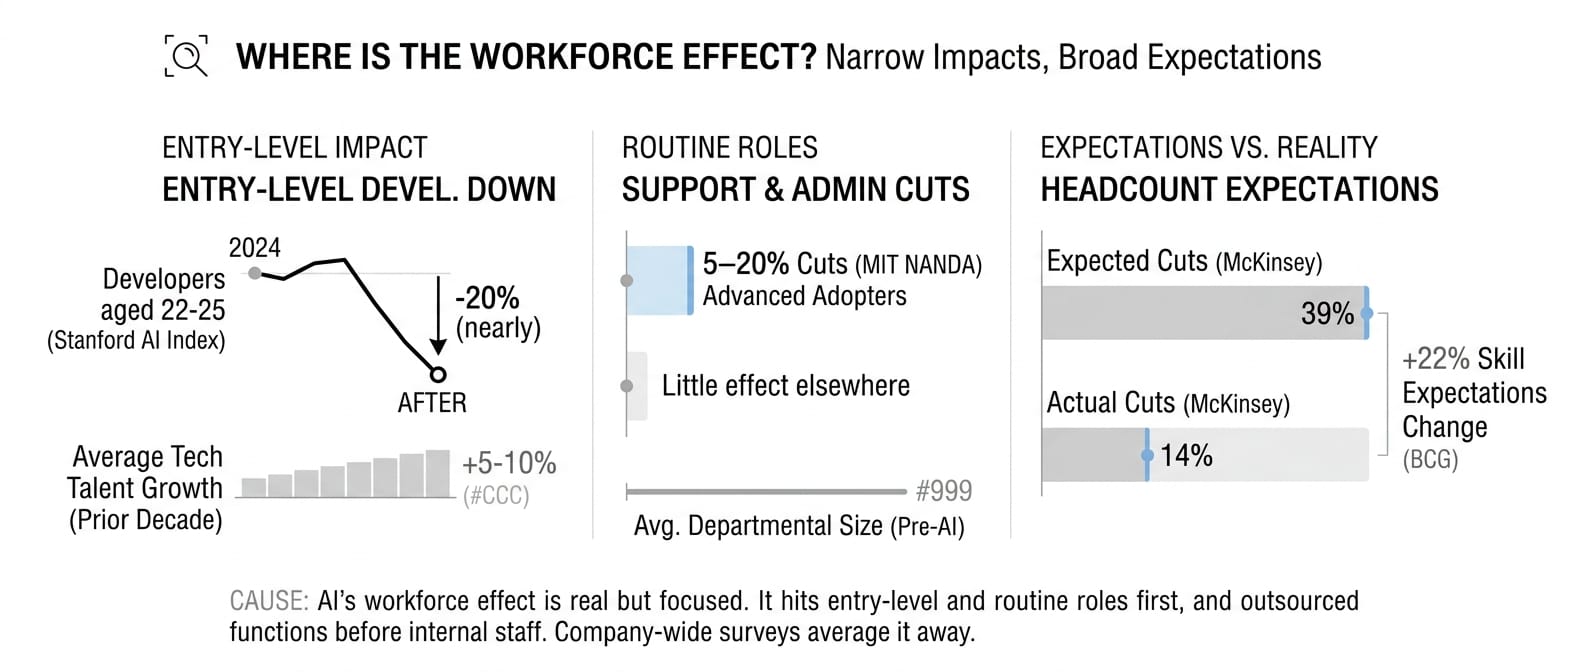
| Work changes before headcount | 39% expect cuts, 14% saw them; entry-level developers down nearly 20% | McKinsey, BCG, Stanford |
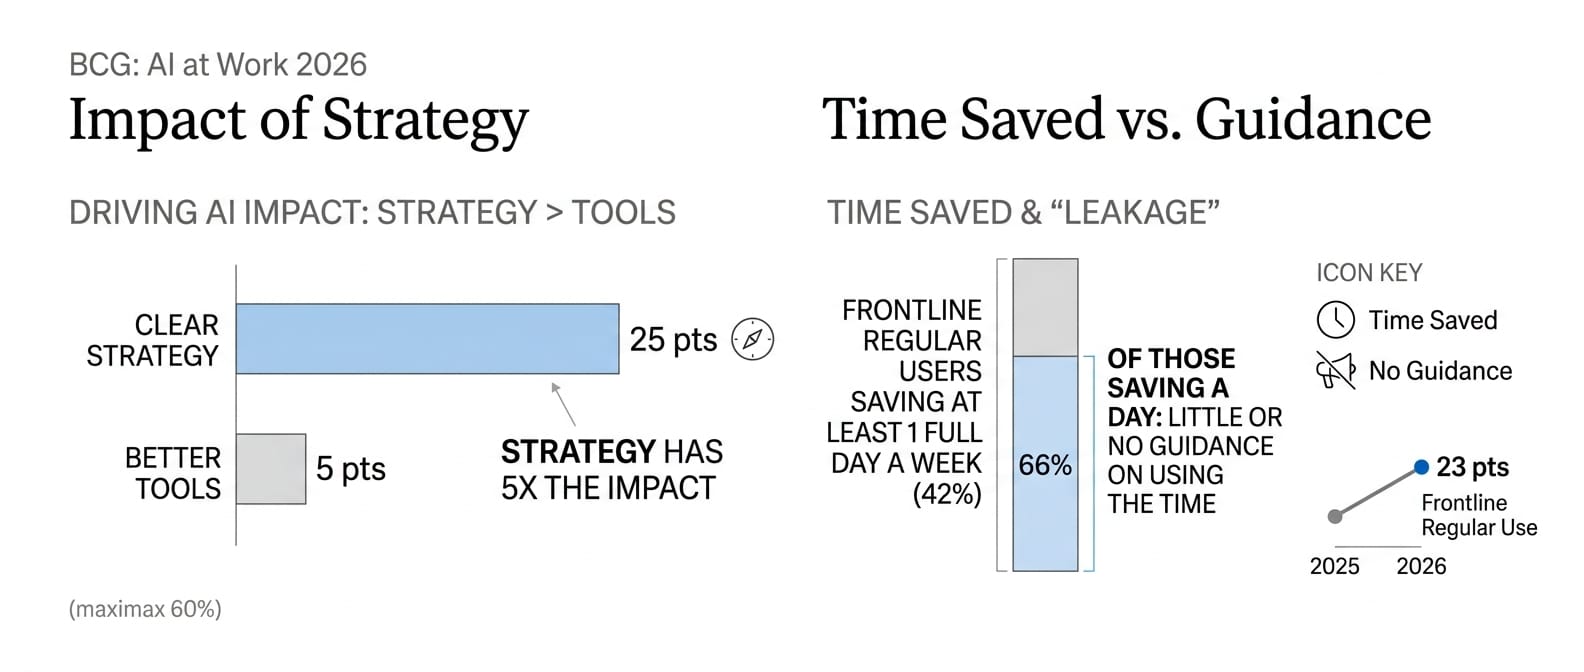
Use is broad, value is concentrated: McKinsey counts nearly 9 in 10 respondents using AI regularly, but only 37% report EBIT impact and about 6% qualify as high performers. Deloitte finds 66% reporting efficiency gains and 20% reporting revenue growth, while 74% still hope for it. BCG shows the leak: 42% of frontline regular users save at least a full day a week, and 66% of those get little or no guidance on what to do with the time.
Spending keeps rising, unit prices keep falling: Menlo puts US enterprise GenAI spend at $37B in 2025, up from $11.5B in 2024. a16z's CIOs expect their average LLM spend to rise about 65%, to $11.6M. McKinsey has 60% expecting AI investment to increase.
At the same time Ramp measures the effective price per million tokens down 41% from its March 2026 peak, and median AI spend per employee at its top 1% of spenders down 9.7%. Total spend and unit cost are moving in opposite directions.
Buying beats building, for now: Menlo finds 76% of AI use cases purchased, up from 53% a year earlier. MIT finds external partnerships reaching deployment about twice as often as internal builds. The first crack: McKinsey reports 32% of respondents avoided buying software because coding agents let them build it internally.
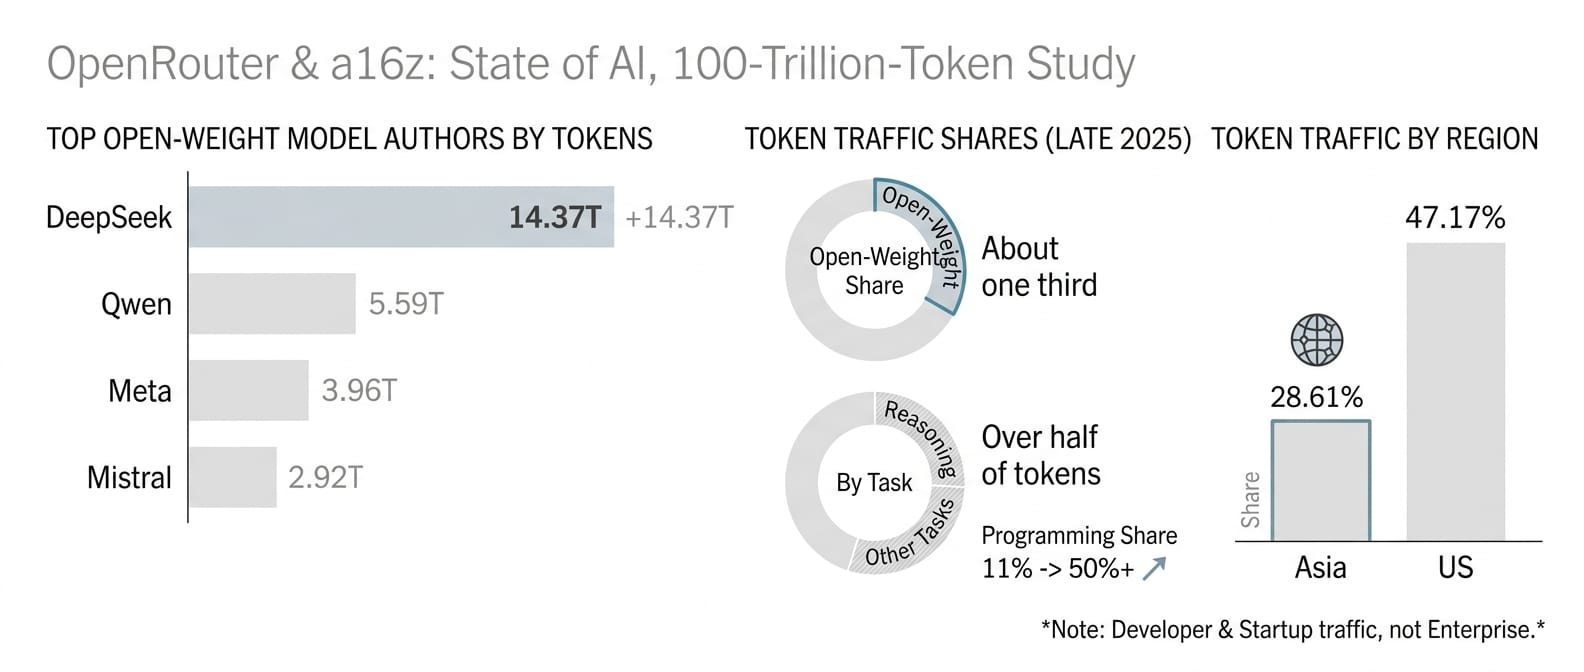
Coding is the first workload at scale: it is the largest departmental AI category in Menlo's data at $4.0B, 55% of departmental spend. On OpenRouter, programming grew from about 11% of tokens in early 2025 to over half. Hugging Face reports AI agents became the largest user of its hub in July 2026.
Multi-model is the norm: a16z finds 81% of large enterprises using three or more model families, up from 68% a year earlier. Even the CIOs who prefer closed models run several of them. Portability is no longer a theoretical concern.
Work changes before headcount does: McKinsey has 39% expecting AI-driven headcount reductions next year but only 14% reporting actual reductions last year. BCG finds 47% of workers spending more time directing AI than doing the work themselves. The Stanford AI Index records employment of software developers aged 22 to 25 down nearly 20% since 2024: the first measurable effect lands on entry-level roles, not across the board.
The Stanford AI Index sometimes draws its corporate adoption figure from McKinsey's survey. Its 2026 economy chapter labels the 88% organisation-adoption figure as McKinsey data, so that number appearing in both is one measurement quoted twice, not two confirming each other. Agreement only counts when the methods are independent.
Where they contradict each other
The same numbers look contradictory because the denominators change.
1. Do AI pilots fail?
| Source | Number | What was measured |
|---|---|---|
| MIT NANDA | 95% get zero measurable return; 5% of task-specific GenAI reaches production | P&L impact of integrated, task-specific GenAI; 52 interviews, 153 conference respondents, H1 2025 |
| McKinsey | 44% at enterprise scale; 37% EBIT impact | Self-reported scaling and EBIT effect, 1,719 respondents, mid-2026 |
| Menlo | 47% of AI purchases reach production | Conversion of bought AI tools, US enterprises |
Cause: MIT asks the hardest question (measurable P&L impact of custom-integrated tools) of a small, early sample. Menlo counts bought products, which arrive production-ready. McKinsey asks respondents to judge their own scaling.
The "95% fail" headline survives because it is the most quotable, not because it contradicts the others. It measures a different and narrower thing.
2. How big is open source?
| Source | Number | Population |
|---|---|---|
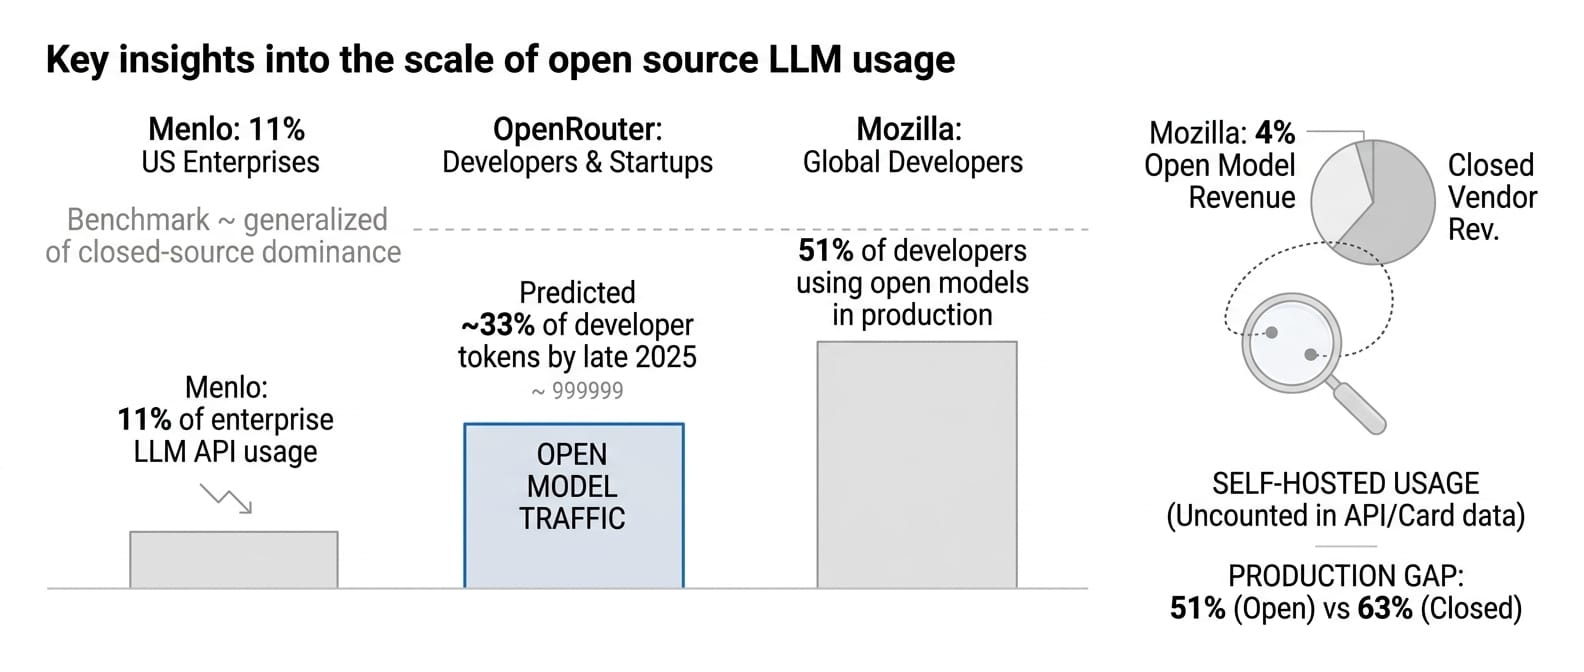
| Menlo | 11% of enterprise LLM usage, down from 19% | US enterprises, API usage |
| OpenRouter | About one third of tokens by late 2025 | Developers and startups routing through OpenRouter |
| Ramp | 6.4% of AI-spending businesses | US businesses paying an open-source or routing platform by card |
| Mozilla | 79% of developers use open models, 51% run them in production vs 63% for closed | Developers |
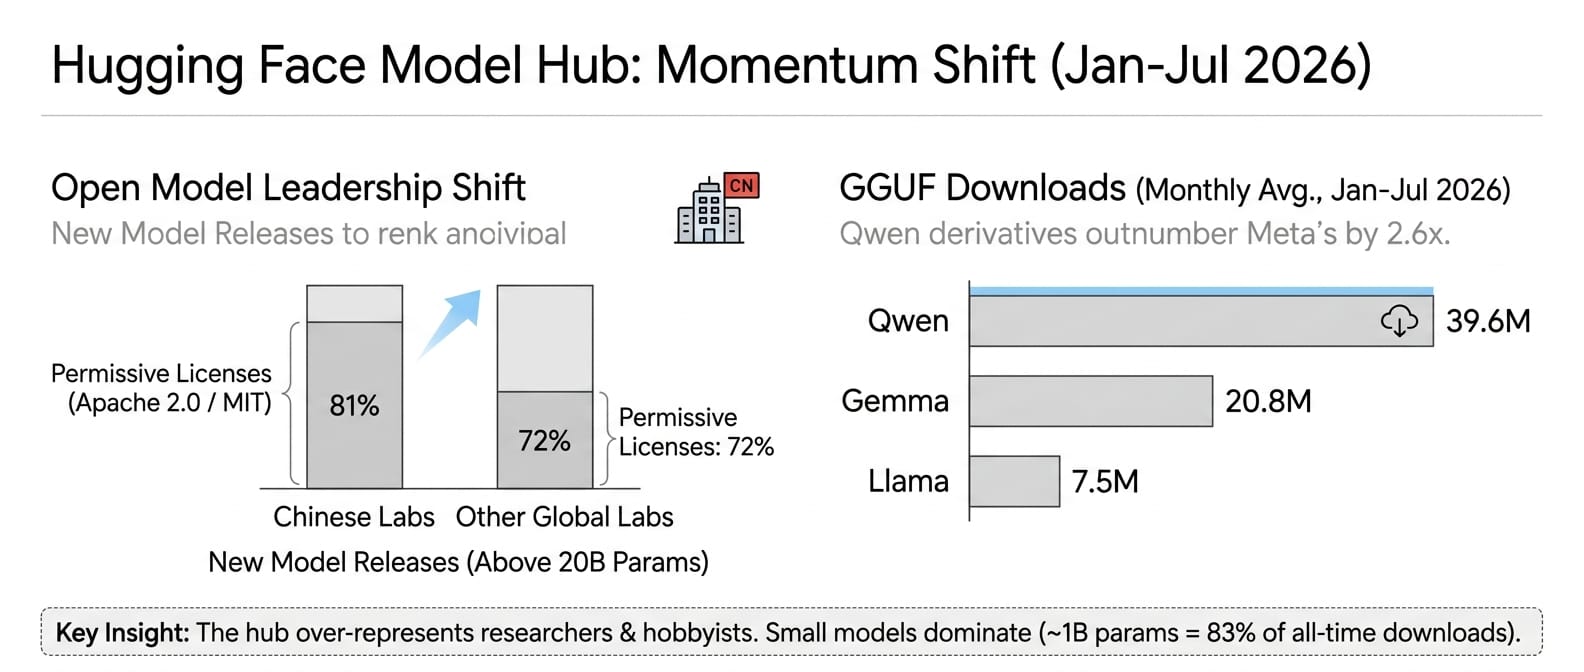
| Hugging Face | 151,448 Qwen derivatives; models under 1B take 83% of downloads | Model hub activity |
Cause: each source sees a different slice. US enterprise procurement buys closed APIs. Developers experiment with open models heavily and route a lot of traffic through them.
Self-hosted open models never appear in API or card-spend data at all, so Menlo and Ramp undercount them by design. Mozilla's production gap (51% vs 63%) is the honest middle: open models get used everywhere, but reach production less often, mostly for operational reasons. Mozilla also puts open models at about a third of real-world usage and 4% of revenue: lots of tokens, little vendor revenue, because the value accrues to whoever runs them.
3. Who leads the vendor race?
| Source | Leader | Metric |
|---|---|---|
| a16z | OpenAI: 78% use in production, ~56% wallet share | Large-enterprise installed base |
| Menlo | Anthropic: 40% of enterprise LLM API share vs OpenAI 27% | US enterprise API spend |
| Ramp | Anthropic: 43.8% of US businesses vs OpenAI 39.8% | Paid adoption via business spend |
Cause: "used in production somewhere" favours the vendor with the broadest footprint. API spend favours the vendor that dominates coding, the largest workload. Card spend favours whichever tool individual teams buy themselves.
4. How common are agents?
| Source | Number | Definition |
|---|---|---|
| Menlo | 16% of enterprise deployments | "True agents": plan, act, observe in a loop |
| McKinsey | 40% of large enterprises, 22% of smaller ones, scaling agents | Respondent's own definition |
| Deloitte (Australia) | 69% use autonomous agents; 22% have advanced agent governance | Respondent's own definition |
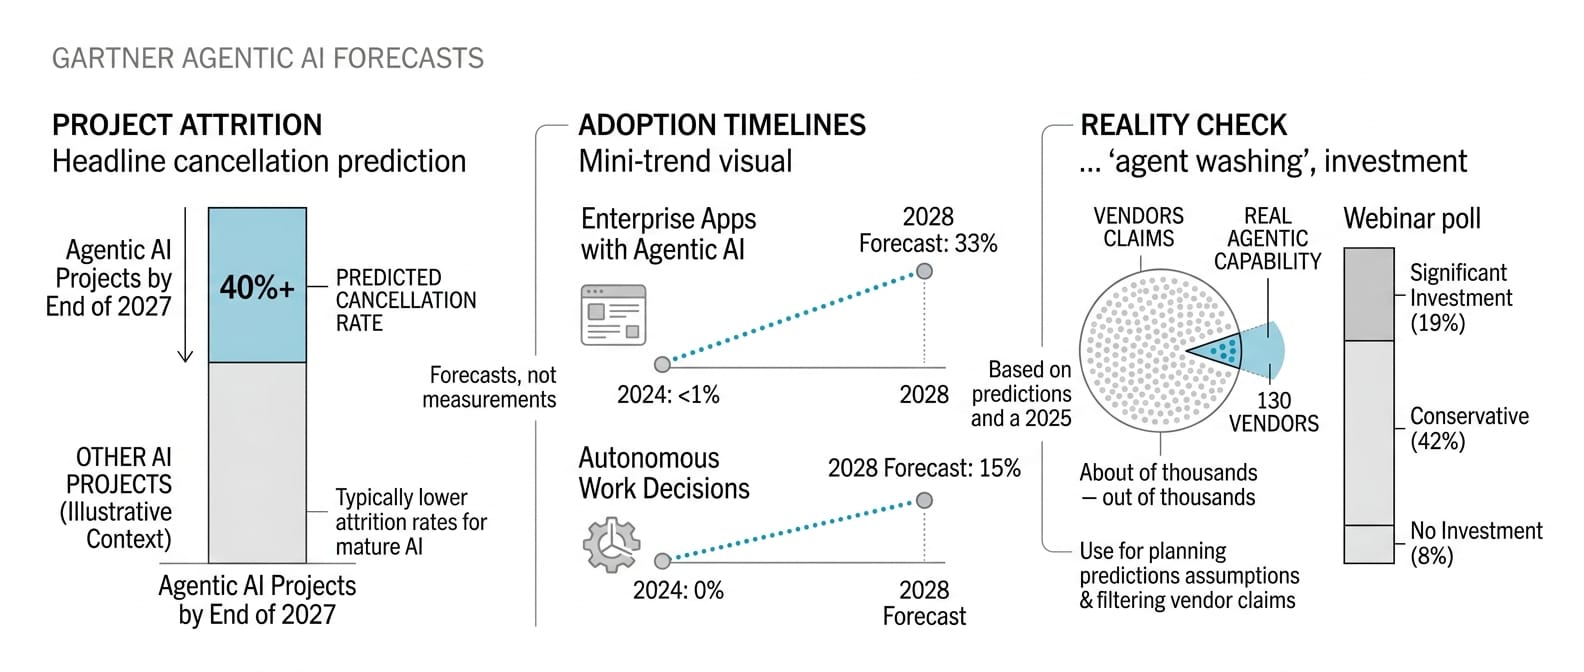
| Gartner | Over 40% of agentic AI projects cancelled by end of 2027; only about 130 of thousands of agentic vendors are real | Analyst forecast |
Cause: definition, almost entirely. Gartner's "agent washing" point explains the spread: assistants, RPA and chatbots relabelled as agents inflate self-reported numbers. The gap that matters is Deloitte's: 69% using agents against 22% governing them properly.
5. Is there ROI?
| Source | Number |
|---|---|
| MIT NANDA | 95% zero measurable P&L return |
| McKinsey | 37% EBIT impact; 80% individual productivity gains |
| Deloitte | 66% efficiency gains; 20% revenue growth |
| BCG | Clear strategy lifts AI impact 25 points; better tools 5 points |
Cause: productivity is easy to feel and hard to bank. Time saved only becomes EBIT when someone redesigns the workflow, cuts a cost or sells more. All four reports point to the same mechanism from different angles.
BCG's number is the most actionable: strategy and redesign move the result five times more than better tools.
6. Where is the workforce effect?
| Source | Number |
|---|---|
| McKinsey | 39% expect headcount cuts; 14% report actual cuts |
| Stanford AI Index | Developers aged 22 to 25 down nearly 20% since 2024 |
| MIT NANDA | 5-20% cuts in support and admin at advanced adopters, little elsewhere |
| BCG | 72% say skill expectations changed considerably |
Cause: the effect is real and narrow. It hits entry-level and routine roles first, and outsourced functions before internal staff. Company-wide surveys average it away.
What the reports miss: APAC
Line up the reports by geography and a gap appears.
| Report | APAC coverage |
|---|---|
| Menlo, Ramp | None: US only |
| a16z, McKinsey | Asian respondents included, no regional cut published |
| Deloitte | Australia cut published; no ASEAN cut |
| BCG | India above the global average; no figures by APAC market |
| Stanford AI Index | Singapore 61% population GenAI adoption vs 53% global and 28.3% US |
| OpenRouter | Asia 28.61% of tokens; Singapore 9.21%, second only to the US |
| Mozilla | China and East Asia 89% open-source adoption |
| Hugging Face | Chinese labs set the open-model frontier in almost every month of 2026 |
The usage-based sources show APAC ahead.
Singapore's population adoption beats the US by a wide margin. Singapore alone generates more OpenRouter tokens than China, and more than Korea, Japan and India combined, although billing location may flatter it: OpenRouter uses billing geography, and enterprise accounts can aggregate activity across multiple regions under one billing entity. East Asian developers use open models more than anyone.
The buyer surveys that set boardroom benchmarks barely sample the region. So an APAC company comparing itself to "the market" is usually comparing itself to US enterprises. That benchmark understates open-model use, overstates concentration on two US vendors, and misses the procurement questions that dominate here: Deloitte's Australian respondents say 72% consider a vendor's country of origin, a question US surveys rarely ask.
No source in this set publishes an ASEAN enterprise benchmark.
How to read the next AI report
A new report with a new headline number will appear next month. Seven questions sort a useful number from a quotable one.
| Question | Why it matters | Example |
|---|---|---|
| Who was asked? | Leaders, workers, developers and spend data see different worlds | 11% open source (enterprise buyers) vs a third (developer traffic) |
| How many, and how chosen? | Small or self-selected samples skew to enthusiasts | a16z: 100 leaders, not random |
| What exactly was counted? | Use, production and P&L are different questions | McKinsey: 80% productivity vs 37% EBIT, same survey |
| Where? | US-only data is not a global or APAC benchmark | Menlo, Ramp |
| When was the fieldwork? | Publication can lag fieldwork by months | Deloitte 2026 report, fieldwork Aug-Sep 2025 |
| Who paid, and what do they sell? | Borderline judgements lean toward the sponsor's business | VC portfolios, transformation consultancies, open-source advocacy |
| Is the headline the narrow claim? | Headlines drop the qualifiers | MIT's "95%" is P&L impact of task-specific tools, not all pilots |
Apply the same questions to your own internal AI dashboard. "Adoption" in your company probably means licences issued. Value means something else.
Where this is going
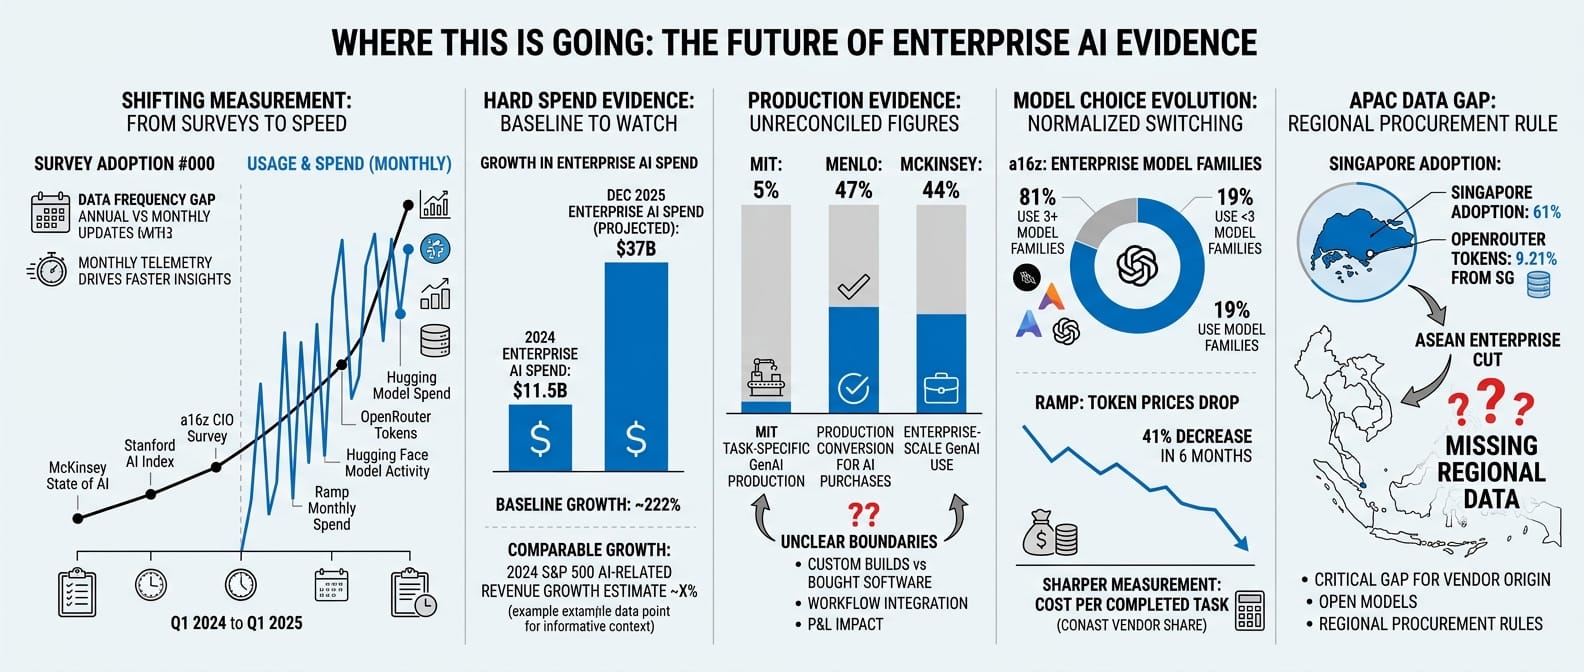
The evidence base is moving in two directions at once. Surveys still set the boardroom numbers, but the faster sources are telemetry and spend: Ramp updates monthly, OpenRouter counts tokens, and Hugging Face counts model activity. Those sources will not replace surveys because each is platform-specific, but they make it harder for "adoption" to stand in for usage.
The next useful editions are the recurring ones. Ramp is already monthly. Stanford's AI Index is annual, McKinsey's State of AI is annual, and a16z describes its CIO survey as annual.
Menlo's December 2025 report is the spend baseline to watch because its 2024-to-2025 jump from $11.5B to $37B is one of the few hard enterprise-spend series in the set.
The question will also shift from pilots to production evidence. MIT's 5% production figure for task-specific GenAI, Menlo's 47% production conversion for AI purchases, and McKinsey's 44% enterprise-scale figure cannot be reconciled until reports separate custom builds, bought software, workflow integration and P&L impact.
Model choice will become less useful as a headline. a16z already has 81% of large enterprises on three or more model families, and Ramp has token prices down 41% in six months. Once model switching is normal, the sharper measurement is cost per completed task, not vendor share or tokens alone.
The weakest part of the evidence base is still APAC enterprise data. Singapore shows 61% population adoption and 9.21% of OpenRouter tokens, but no report in this set publishes an ASEAN enterprise cut. That gap will matter more as vendor origin, open models and regional procurement rules become part of the buying decision.
Part 2: The reports, one by one
Twelve reports, one card each
Each card has the same two tables: how the report was built, then its key numbers.
Menlo Ventures: 2025 State of Generative AI in the Enterprise
The most quoted source on enterprise AI spend and vendor share. Menlo combines a buyer survey with a bottom-up market model, which makes it strong on money and weak on anything that does not show up in a purchase.
| Published | December 2025 |
| Sample | 495 US enterprise AI decision-makers at companies already using AI |
| Fieldwork | November 7 to 25, 2025, plus a bottom-up market model |
| Region | US only |
| Watch for | Venture investor with disclosed portfolio exposure; market sizing excludes chips, self-hosted inference and AI inside existing software |
| Metric | Value |
|---|---|
| US enterprise GenAI spend, 2025 | $37B (2024: $11.5B; 2023: $1.7B) |
| Split | Applications $19B, infrastructure $18B |
| Use cases bought vs built | 76% bought (2024: 53%) |
| AI purchases reaching production | 47% (traditional SaaS: 25%) |
| Coding share of departmental AI spend | $4.0B, 55% |
| Enterprise LLM API share | Anthropic 40%, OpenAI 27%, Google 21% |
| Open-source share of enterprise usage | 11% (2024: 19%) |
| Chinese open models | About 1% of enterprise API usage |
| Deployments that are true agents | 16% (startups: 27%) |
How to use it: for US enterprise spend, vendor share and the build-vs-buy split. Do not use its 11% open-source figure as a global number: self-hosted models are invisible to an API spend model, and the sample is US only.
a16z: Enterprise CIO survey
A small, senior and deliberately selected panel. It shows what the largest companies are doing, which is often where the rest of the market goes twelve months later.
| Published | January 30, 2026 |
| Sample | 100 verified VP and C-level leaders at Global 2000 companies; 88% above $1B revenue |
| Method | Third annual survey, targeted, not random |
| Region | US, Canada, UK, EU, Asia, Australia; no regional cut |
| Watch for | Advanced adopters over-represented; a16z invests in OpenAI and OpenRouter |
| Metric | Value |
|---|---|
| OpenAI used in production | 78%; about 56% wallet share |
| Anthropic used in production | 44% (63% including testing) |
| Using three or more model families | 81% (a year earlier: 68%) |
| Average LLM spend | About $7M, expected to reach about $11.6M |
| Prefer AI from incumbent vendors | 65% |
| Say reasoning models sped up adoption | 54% |
How to use it: for the direction of travel at Global 2000 scale, especially multi-model adoption and incumbent-vendor preference. Do not read 100 hand-picked leaders as the market average.
McKinsey: The state of AI in 2026
A long-running annual management survey on AI. Its strength is the time series: largely the same questions, asked every year, across regions and company sizes.
| Published | August 25, 2026 |
| Sample | 1,719 respondents in 97 countries; 36% at companies above $1B revenue |
| Fieldwork | May 4 to June 8, 2026, online, weighted by GDP |
| Region | Global; no APAC cut published |
| Watch for | Self-reported judgements of scale and impact |
| Metric | Value |
|---|---|
| Use AI regularly in at least one function | Nearly 9 in 10 |
| AI at enterprise scale | 44% (2025: 38%) |
| AI in three or more functions | 56% (2025: 51%) |
| Large enterprises scaling agents | 40% (2025: 27%); smaller organisations 22% |
| Positive EBIT impact | 37% |
| AI high performers | About 6% |
| Individual productivity gains | 80% |
| Spend more than 10% of ICT budget on AI | 28% |
| Expect headcount cuts next year / saw cuts last year | 39% / 14% |
| Skipped buying software because coding agents built it | 32% |
How to use it: for trends in scaling, agents and EBIT impact, and for the gap between individual productivity (80%) and enterprise value (37%). Remember that every number is a respondent's own judgement.
Deloitte: State of AI in the Enterprise, 2026
A large survey of senior leaders that is unusually specific about which benefits have materialised and which are still hoped for. The Australian cut is one of the few published APAC breakdowns.
| Published | 2026 |
| Sample | 3,235 senior leaders, half IT, half business, six industries |
| Fieldwork | August to September 2025 |
| Region | 24 countries; Australia cut published |
| Watch for | Skews to organisations already advanced in AI; fieldwork a year before the read date |
| Metric | Value |
|---|---|
| Productivity or efficiency gains | 66% |
| Better insights and decisions | 53% |
| Cost reduction | 40% |
| Revenue growth realised / hoped for | 20% / 74% |
| AI used for deep transformation / surface level | 34% / 37% |
| Plan to raise AI investment | 84% globally, 65% Australia |
| Australia: use autonomous agents / advanced agent governance | 69% / 22% |
| Australia: consider vendor country of origin | 72% |
How to use it: for the realised-vs-hoped gap (20% revenue growth against 74% expecting it) and for agent governance. Note that fieldwork ran in August and September 2025.
MIT NANDA: The GenAI Divide, State of AI in Business 2025
The source of the most repeated statistic in enterprise AI. The report itself is careful: it measures measurable P&L impact from integrated, task-specific GenAI, and labels its findings preliminary. The way it is quoted is not.
| Published | July 2025, as preliminary findings |
| Sample | 300+ public AI initiatives reviewed, 52 organisations interviewed, 153 senior leaders surveyed at four conferences |
| Fieldwork | January to June 2025 |
| Region | Not disclosed |
| Watch for | Small, conference-sourced sample; the headline is far narrower than the way it is quoted |
| Metric | Value |
|---|---|
| Organisations with zero measurable P&L return | 95% |
| Task-specific GenAI: evaluated / piloted / in production | 60% / 20% / 5% |
| Generic tools: explored / deployed | 80%+ / about 40% |
| Companies where staff use personal AI tools | 90%+ |
| Companies with official LLM subscriptions | 40% |
| Deployment rate: external partnership vs internal build | About 67% vs 33% |
| Cuts at advanced adopters | 5-20% in support and admin |
How to use it: for the gap between generic tools that staff adopt on their own and custom tools that rarely reach production, and for the case for external partners. Do not quote "95% of AI fails" without the qualifiers.
BCG: AI at Work 2026
The largest worker survey in this set, and the best source on what AI does to daily work. It says little about spend or vendors, which is exactly why it complements the buyer surveys.
| Published | June 3, 2026 |
| Sample | 11,749 workers |
| Region | 14 markets; India above the global average |
| Watch for | Worker self-report; nothing direct on spend or P&L |
| Metric | Value |
|---|---|
| Skill expectations changed considerably | 72% |
| Spend more time directing AI than doing the work | 47% |
| Frontline regular AI use | 74% (up 23 points) |
| Frontline regular users saving a full day a week | 42% |
| Of those, little or no guidance on using the time | 66% |
| Regular users with higher job satisfaction | 67% |
| Report higher cognitive load | 41% |
| Lift in AI impact: clear strategy vs better tools | 25 points vs 5 points |
How to use it: for where productivity leaks: time saved that nobody redirects, and the finding that strategy moves impact five times more than tools.
Mozilla: State of Open Source AI 2026
The first edition of a developer-side view of open models. Its most useful number is the production gap: developers use open models widely but deploy them less often than closed ones.
| Published | July 2026; v1.1 September 2026 |
| Sample | 950+ developers (fieldwork with SlashData), plus Mozilla analysis |
| Region | Global |
| Watch for | Mozilla advocates for open-source AI |
| Metric | Value |
|---|---|
| Developers using open models | 79% |
| Running in production: open vs closed | 51% vs 63% |
| Open models' share of real-world usage / of revenue | About a third / about 4% |
| Open-source adoption, China and East Asia | 89% |
| Buyer priorities | Licence terms and ownership rank high |
How to use it: for open-model usage among developers and the reasons it does not always reach production. Weigh it against Mozilla's open-source advocacy.
OpenRouter and a16z: State of AI, a 100-trillion-token study
Measured traffic, not opinions. OpenRouter routes requests to hundreds of models, so its logs show which models developers actually call, at what volume and for what kind of task.
| Published | December 2025 |
| Data | 100T+ tokens, 300+ models, 70+ providers; metadata only, no prompt content |
| Period | November 2024 to November 2025 |
| Region | Global, by billing address |
| Watch for | Developer and startup traffic, not enterprise; a16z invests in OpenRouter |
| Metric | Value |
|---|---|
| Open-weight share of tokens, late 2025 | About one third |
| Chinese open models | 13% on average, near 30% in peak weeks |
| Reasoning models | Over half of tokens |
| Programming share of tokens | From about 11% to over 50% |
| Asia share of tokens | 28.61% |
| By country | US 47.17%, Singapore 9.21%, China 6.01%, Korea 2.88%, Japan 1.77%, India 1.62% |
| Top open-model authors by tokens | DeepSeek 14.37T, Qwen 5.59T, Meta 3.96T, Mistral 2.92T |
How to use it: for model mix, open-weight share, the rise of reasoning and coding workloads, and Asian usage. Do not treat developer and startup traffic as enterprise production.
Ramp AI Index, September 2026
A monthly index built from what US businesses actually pay for. It is the fastest-moving source in this set and the only one that tracks unit prices and spend per employee month by month.
| Published | September 9, 2026 |
| Data | Business card and bill-pay spend from Ramp customers |
| Region | US only |
| Watch for | Cannot see self-hosted models or AI bought through cloud contracts |
| Metric | Value |
|---|---|
| US businesses paying for AI | 56.1% |
| Paid adoption: Anthropic / OpenAI | 43.8% / 39.8% |
| Effective price per million tokens | $0.68, down 41% from $1.15 in March 2026 |
| Top-1% spenders, median AI spend per employee per month | $7,205, down 9.7% |
| Frontier models' share of tokens | 45% (August peak: 53%) |
| Paying an open-source or routing platform | 6.4% of AI-spending businesses |
How to use it: for paid adoption among US businesses, vendor momentum and token price trends. It cannot see self-hosted models or AI bought inside cloud contracts.
Hugging Face: State of Open Models, Summer 2026
The view from the largest model hub: what gets released, downloaded and adapted. It is the best source on which open models developers build on, and on the shift in open-model leadership to Chinese labs.
| Published | August 14, 2026 |
| Data | Hugging Face Hub activity, January to July 2026 |
| Region | Global |
| Watch for | Downloads are not deployments; the hub over-represents researchers and hobbyists |
| Metric | Value |
|---|---|
| Public model repositories | 2.43M to 2.96M |
| Repositories taking 99.2% of downloads | 1.5% |
| Qwen derivatives | 151,448, 2.6 times Meta's footprint |
| Share of all-time downloads: under 1B / over 100B | 83% / 1% |
| GGUF downloads per month | Qwen 39.6M, Gemma 20.8M, Llama 7.5M |
| Licences on Chinese releases above 20B | 59% Apache 2.0, 22% MIT |
| Largest user of the hub | AI agents, from July 2026 |
How to use it: for open-model momentum, licence patterns and the dominance of small models in practice. Downloads are not deployments.
Stanford HAI: AI Index 2026
An annual compendium rather than a survey. It is the best single source for investment, research output, benchmarks and country comparisons, including Singapore's lead in population adoption.
| Published | April 2026 |
| Data | Annual compilation of public and private datasets |
| Region | Global |
| Watch for | Inherits its sources' biases; some numbers are other reports quoted again |
| Metric | Value |
|---|---|
| Global corporate AI investment, 2025 | $581.7B, up 130% |
| Private AI investment: US / China | $285.9B / $12.4B |
| Population GenAI adoption | 53% global, Singapore 61%, US 28.3% |
| Foundation Model Transparency Index | Fell from 58 to 40 |
| Agent benchmark progress (OSWorld) | From 12% to about 66% task success |
| Software developers aged 22 to 25 employed | Down nearly 20% since 2024 |
How to use it: for macro figures and international comparison. Check where each number comes from before treating it as independent confirmation of another report.
Gartner: agentic AI predictions
Forecasts from Gartner's analysts. Its agentic AI release is useful less for the headline cancellation rate than for naming "agent washing": products relabelled as agents without agentic capability.
| Published | June 25, 2025 |
| Basis | Analyst predictions, plus a January 2025 poll of 3,412 webinar attendees |
| Region | Global |
| Watch for | Forecasts, not measurements; the poll is a webinar audience |
| Metric | Value |
|---|---|
| Agentic AI projects cancelled by end of 2027 | Over 40% |
| Day-to-day work decisions made autonomously by 2028 | 15% (2024: 0%) |
| Enterprise applications with agentic AI by 2028 | 33% (2024: under 1%) |
| Real agentic vendors among thousands | About 130 |
| Poll: significant / conservative / no investment in agentic AI | 19% / 42% / 8% |
How to use it: as a planning assumption and a reality check on vendor claims. These are predictions, not measurements.
Sources
- Menlo Ventures: 2025 The State of Generative AI in the Enterprise (December 2025)
- a16z: Leaders, gainers and unexpected winners in the Enterprise AI arms race (January 30, 2026)
- McKinsey: The state of AI (August 25, 2026)
- Deloitte: The State of AI in the Enterprise (2026)
- MIT NANDA: The GenAI Divide, State of AI in Business 2025 (July 2025)
- BCG: AI Is Reshaping Jobs Faster Than Companies Are Reshaping Work (June 3, 2026)
- Mozilla: State of Open Source AI 2026 (September 2026)
- OpenRouter and a16z: State of AI (December 2025)
- Ramp AI Index, September 2026 (September 9, 2026)
- Hugging Face: State of Open Models, Summer 2026 (August 14, 2026)
- Stanford HAI: The 2026 AI Index Report (April 2026)
- Gartner: Over 40% of Agentic AI Projects Will Be Canceled by End of 2027 (June 25, 2025)
- rAInvent: Open weights don't make enterprise AI cheaper. They make it portable. (October 3, 2026
)